Property Analysis
1 Introduction
It is a truth universally acknowledged that a married man in possession of a good fortune must be in want of a house.
I've taken the liberty of updating good old Jane's statement for more contemporary times. This article talks about my process of looking at and understanding property prices in Ireland.
Some background for my non-Irish readers:
- Ireland was mostly poor from the 1930's to the 1990's
- Banks were very hesitant to lend money to anyone
- And the interest rates were very high
This all changed during the Celtic Tiger period, when a flood of cheap euro-denominated money was dropped in by German and French helicopters 1. This lead (predictably) to a massive property bubble, which was sadly interrupted by the advent of financial contagion in 2007. Over the next few years, the economy fell apart, we were dragged into a bailout program, and house prices collapsed.
A few years after that, they started to recover, and right now, we have a massive housing crisis in that people can't afford houses, which puts more stress on the rental market, increasing prices.
Given that I don't trust the property-porn engaged in by the media and government, I decided to take matters into my own hands, and consult the property price register (PPR for future reference) and figure out whether or not I should buy or continue to slum it in a hell of short-term lets and fear 2.
1.1 Property Price Register
So, the property price register was established in the depths of the economic crisis 3, and so has a number of problems. The most obvious is that we only have data from 2010. Given data from the boom, it would be a much easier task to estimate tops and bottoms, but we can only work with what we have. The second problem with the data is that Ireland doesn't have postcodes 4, which makes localisation of the properties a challenge.
Nonetheless, the nice people at the PPR have collated the data for us, so there is that. They helpfully provide the data in CSV format, and have a document which contains all of the property data, which can be found here 5
So, on with the show! 6
1.1.1 Data Cleaning
In data analysis, much as in life, cleaning is important. Unfortunately, while keeping ones house and body cleaning rarely takes up all of one's time, data cleaning, can, and often does take up almost all of the time. So, enjoying (or at least not hating) this process, is an important career skill.
Anyways, so the first thing we do is look at the data, to assess what needs to be done.
dat  <- readr::read_csv("PPR_2020.csv")
  ## dat <- readxl::read_excel("PPR-ALL.xlsx", sheet="PPR-ALL")
  names(dat)
| Date of Sale (dd/mm/yyyy) |
| Address |
| Postal Code |
| County |
| Price () |
| Not Full Market Price |
| VAT Exclusive |
| Description of Property |
| Property Size Description |
OK, so we have date (nicely, they have specified the format), address, postal code, county.
I have some problems with these names. The spaces will cause problems, and capitalisation is so passe. I'll fix these problems with some code.
normalise_names <- function(df) {
    nms <- names(df)
    normed <- iconv(
        tolower(
            gsub("([[:space:]]|[[:punct:]])+", "_",
                 x=nms)),
        "latin1", "ASCII", sub="")
    drop_usc <- gsub("([a-z_])_*$", "\\1",
                     x=normed)
    names(df) <- drop_usc
    df
}
This function does a few things:
- it replaces spaces or punctuation with underscores7
- it then converts all text to lowercase
- Then we exert cultural imperialism and export to ascii9
- finally, we replace multiple underscores with one (for tidyness, mostly)
dat2 <- normalise_names(dat)
names(dat2)
| date_of_sale_dd_mm_yyyy |
| address |
| postal_code |
| county |
| price |
| not_full_market_price |
| vat_exclusive |
| description_of_property |
| property_size_description |
Much better. Little things like this add up to a better, more productive life.
Next, we need to remove the commas from the input doc (which have become hopelessly mangled). Again, we abuse iconv, this time on a particular column. My life would be much easier if I took the time to learn how to handle encodings 10
fix_price <- function(x) {
    nopunct <- gsub(",|", "", x=x)
    nums <- iconv(nopunct, "latin1", "ASCII", sub="")
}
dat2$price <- with(dat2, fix_price(price))
These preliminaries accomplished, we can move towards actually looking at the data
prop_df <- dat2 %>%
    mutate(date_of_sale=lubridate::dmy(date_of_sale_dd_mm_yyyy),
           not_full_market_price=as.factor(not_full_market_price),
           postal_code=as.factor(fct_explicit_na(postal_code)),
           vat_exclusive=as.factor(vat_exclusive),
           county=as.factor(county),
           price=as.numeric(price))
prop_df2 <- mutate(prop_df,
                   year=lubridate::year(date_of_sale),
                   month=lubridate::month(date_of_sale),
                   day=lubridate::day(date_of_sale))

prop_sample <- sample_frac(prop_df2, size=0.1)
We also take a ten percent sample, just to speed up the analysis 11
1.1.2 Wasting Time with Plots
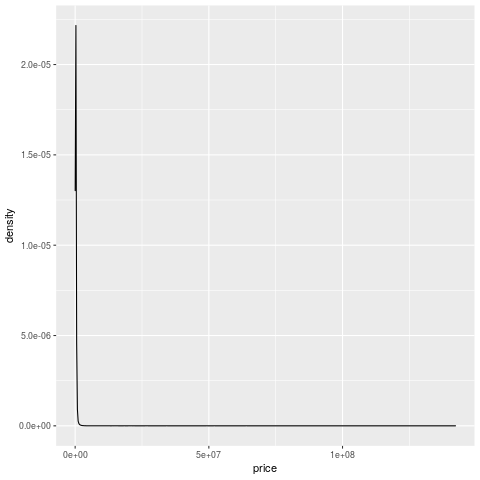
So, when we do the simplest plot ever (a one-way summary of price), it looks pretty weird. Most of the density is in the one line near zero, and there's a long tail that goes up to 100mn. Who are these people buying houses for many millions of euros? More importantly, how can I become one of them?
The first thing to do when you find something weird like this is to take a look at the observations and see if they are different 12. Let's sort the data by price and look at the addresses.
arrange(prop_df, desc(price)) %>%
    select(address, county, date_of_sale, price) %>%
    head()
| address | county | date_of_sale | price |
|---|---|---|---|
| Blocks A and C, The Point Campus | Dublin | 2019-12-23 | 142256576.05 |
| COMMERCIAL PROPERTY AND, 423 RESI UNITS AT CLANCY QUAY, ISLANDBRIDGE | Dublin | 2018-06-22 | 139165000 |
| 266 Apts & 18 Commercial Units, Heuston South Quarter, St. John's Road West | Dublin | 2019-07-19 | 129500000 |
| APARTMENT 1 - 197 NEPTUNE BLOCK, HONEYPARK, DUN LAOGHAIRE | Dublin | 2020-02-27 | 114440820 |
| 189 APARTMENTS AT ELMFIELD, BALLYOGAN, DUBLIN 18 | Dublin | 2020-02-27 | 99762972.37 |
| Apartments 1-164 Fairwary Court, & 1-50 Fairway Hall, Cualanor Upper Glenageary Road | Dublin | 2019-05-27 | 95242291 |
OK, so the Cannon house thing must be more than one apartment. Otherwise things have gone even madder than I thought. Also Apt 204 the Alliance, and 182 the Elysian 13. Entire apartment blocks for 76-86 million makes more sense, however.
arrange(prop_df, desc(price)) %>%
    select(address, county, date_of_sale, price) %>%
    tail()
| address | county | date_of_sale | price |
|---|---|---|---|
| 9 Greenfields, Lanesboro Road, Roscommon | Roscommon | 2015-05-22 | 5179 |
| LAVALLY, BALLINTOGHER | Sligo | 2014-05-01 | 5177 |
| 65 ST JOSEPH'S PARK, NENAGH, CO TIPPERARY | Tipperary | 2018-09-04 | 5080 |
| Loghnabradden, Fintown, Co. Donegal | Donegal | 2012-01-11 | 5079 |
| CLOGHAN, GLENCOLMCILLE, DONEGAL | Donegal | 2014-07-18 | 5079 |
| COULAGHARD, EYERIES, BEARA | Cork | 2019-03-11 | 5030.53 |
- there must be something really wrong with these houses.
It does tell us something about the tails14 of the crash, in that property was worth so little in Roscommon in 2015 that this happened. It may also be an error, as I don't know what kind of checking goes into this data.
However, it's interesting to note that there weren't that many sales. Even at 60k it's only just over 5% of the housing stock 15. That's not a huge amount, but given the lack of data for the boom, it's very difficult to make those judgements.
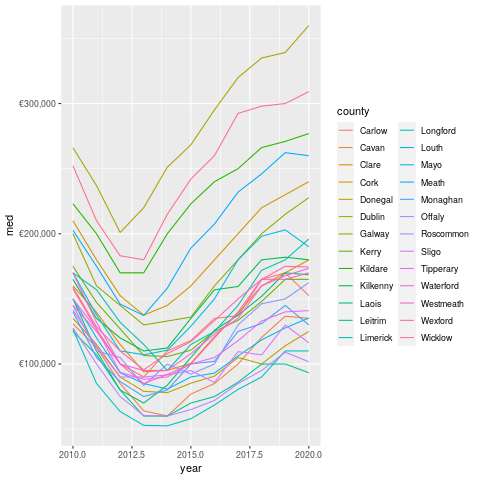
So the overall trend is pretty clear. The chart above shows median prices. For those of you who aren't stats nerds, the median is the middle value. If you laid out all the prices in a line, the median would be the middle of the line. This means that it's a reasonable summary of the distribution.
Really, you should look at the distribution itself, but aggregations such as the median are useful for plots and telling people about.
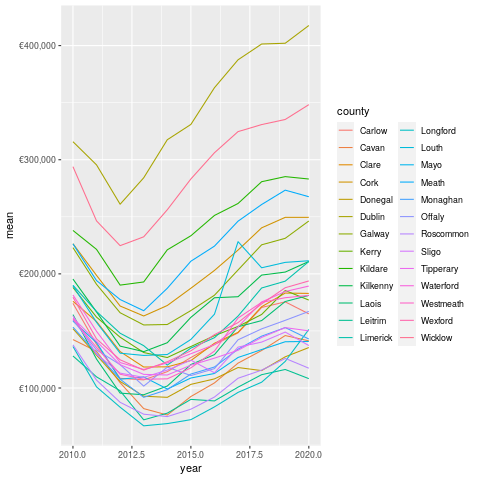 The mean, which is the sum divided by the length of the set of numbers is much higher.
This is pretty normal in most sets of data because huge values at the top or bottom
have more impact on the mean. Again, the same trend is pretty visible. The
mean price in Dublin is 400k, which assuming a 10% deposit means that
a household would need a combined income of approximately 102k.
The mean, which is the sum divided by the length of the set of numbers is much higher.
This is pretty normal in most sets of data because huge values at the top or bottom
have more impact on the mean. Again, the same trend is pretty visible. The
mean price in Dublin is 400k, which assuming a 10% deposit means that
a household would need a combined income of approximately 102k.
This puts houses in Dublin far out of reach of ordinary earners, which is perhaps not surprising given the incredible inflation in asset prices we've seen since the financial crisis in 2008.
Note that I've filtered out the properties sold for more than 2mn, as these are mostly apartment blocks and groups of houses. These probably shouldn't be looked at for this analysis 16.
Looking closer at Dublin (and breaking down by postal code), we can see some more interesting patterns.
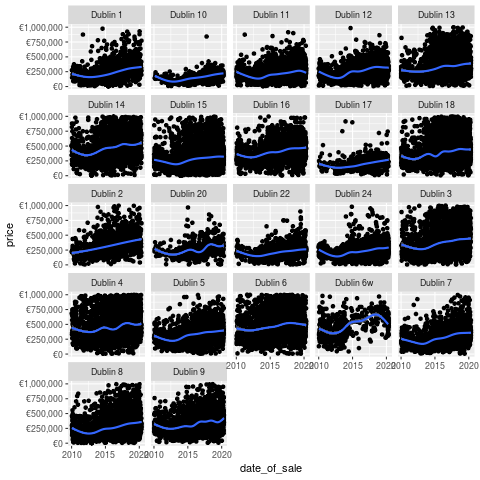 Prices are definitely trending up, but there are some large outliers
across the board.
Prices are definitely trending up, but there are some large outliers
across the board.
Like this former house owned by an executive in Dublin 20, for example. That place definitely doesn't reflect the average experience in that area. In general, I'm beginning to think that there are multiple housing markets in Ireland, not one. This makes sense as one can only compete against others in the same price range. This would suggest that I should regard the house buying denizens of South Dublin to be some kind of alien species. I do enjoy when a data-driven theory agrees with my priors.
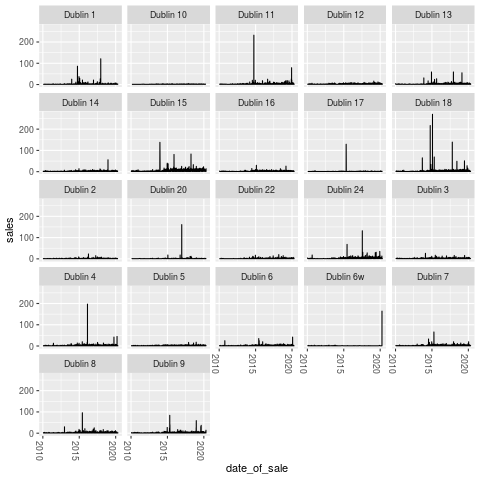
- Long periods of not much activity, followed by sudden spikes.
- We should probably dig into some of the spikes to figure out what they mean.
- It's possible that they may be one overall transaction recorded as multiples (for instance, when an entire apartment block is sold to one developer, and it's recorded unit by unit).
1.1.3 Conclusions
So, above we've reviewed the property price register, and done a bunch of data cleaning, but not really accomplished that much overall. Part Two will cover some other interesting datasets 17, while future parts will cover geocoding the data and looking at spatial patterns, as well as some bayesian modelling with Stan.
Hopefully someone makes it thus far, at least ;).
Footnotes:
In fact, it was done via banks, but it doesn't really have the same ring to it now, does it?
actually I've been in the same house for many years, but I likes a good simile.
by the Greens actually, so at least I don't feel my vote for them was entirely wasted
we do now, but they are not on any of the addresses
they also provide commercial data (which I just noticed), but I am resisting the urge to become distracted
for very nerdy, boring values of show
You could use any character, but I like underscores. It's totally pointless though, so really we should just standardise on one 8
clearly underscores
this whole lack of understanding of encodings is deeply embarassing
look at how well I'm resisting distraction!
turns out sampling is pretty cool, who knew?
or you could just log it and get one with building a CNN I guess
that dude finally made his money back, after opening really expensive apartments just as the crash hit
geddit?
assuming 1mn households. I should probably check this with the CSO
yes, this is really subjective, like almost everything in data analysis. The advantage here is that I provide code so people can change that however they want
it's possible that if you've read this article before you'll note that this was once one article. I came to the conclusion that people might be more inclined to read my article if they weren't more than 10,000 words long.